


This article explores trends in past hurricane data to understand the significance of these warnings and track the evolving nature of hurricanes over the years. As the intensity of hurricanes grows due to the climate crisis, so too does their damage potential and, along with it, the financial costs we deal with in the wake of destruction.
—
Last month, Hurricane Beryl crashed into Texas, taking out power for more than 2 million people. Its sustained high speed winds brought excessive rainfall and flooding inland while creating a deadly storm surge reaching 4-7ft in places along the coast. 36 people have died Texas and Louisiana after 33 deaths across the Caribbean. An initial estimate put the total economic loss from Hurricane Beryl in the United States alone between $28 to 32 billion. This not only includes storm damage but also wage loss, interruptions of supply chains, and flight delays and cancellations.
Hurricane Beryl reached Category 5 status with winds of 165 mph, marking an early start to the hurricane season and becoming the earliest Category 5 hurricane ever recorded. However, it is not necessarily an anomaly. In May, the National Oceanic and Atmospheric Administration (NOAA) issued a warning for an “above average” hurricane season in the North Atlantic, which, according to the World Meteorological Organization, would make 2024 the ninth consecutive year of “above average” hurricane seasons.
This article explores trends in past hurricane data to understand the significance of these warnings and track the evolving nature of hurricanes over the years. As the intensity of hurricanes grows due to the climate crisis, so too does their damage potential and, along with it, the financial costs we deal with in the wake of destruction.
Data & Categorization
The analysis in this article utilizes data from NOAA’s International Best Track Archive for Climate Stewardship (IBTrACS) Project and the Costliest US Tropical Cyclones Listing. The IBTrACS Project compiles comprehensive tropical cyclone data gathered from agencies worldwide, while the listing concentrates on the damage costs incurred in the US due to these cyclones.
This study focuses specifically on hurricanes occurring between 1980 and 2024. Instead of relying on standard classifications, our analysis adopts a modified version of the Saffir-Simpson scale, which includes a newly introduced Category 6, as proposed by recent research. This addition aims to more accurately capture the exponential increases in tropical storm wind speeds, which has been observed more frequently in recent years.
The table below contains a detailed description of the scale that was used.
| Category | Wind Speed | Description |
|---|---|---|
| 1 | 64-82 kt | Very dangerous winds will cause some damage |
| 2 | 83-95 kt | Extremely dangerous winds will cause extensive damage |
| 3 | 96-112 kt | Devastating damage will occur |
| 4 | 113-136 kt | Catastrophic damage will occur |
| 5 | 137-157 kt | Catastrophic damage will occur |
| 6 | > 157 kt | Extremely catastrophic damage will occur |
International Trends
Upon initial observation, the data indicates that the total number of hurricanes is not rising over time. In fact, there appears to be a slight decline in the number of hurricanes, with fewer storms on average each year. The following graph illustrates this trend, showing that the frequency of hurricanes has remained fairly consistent across decades.
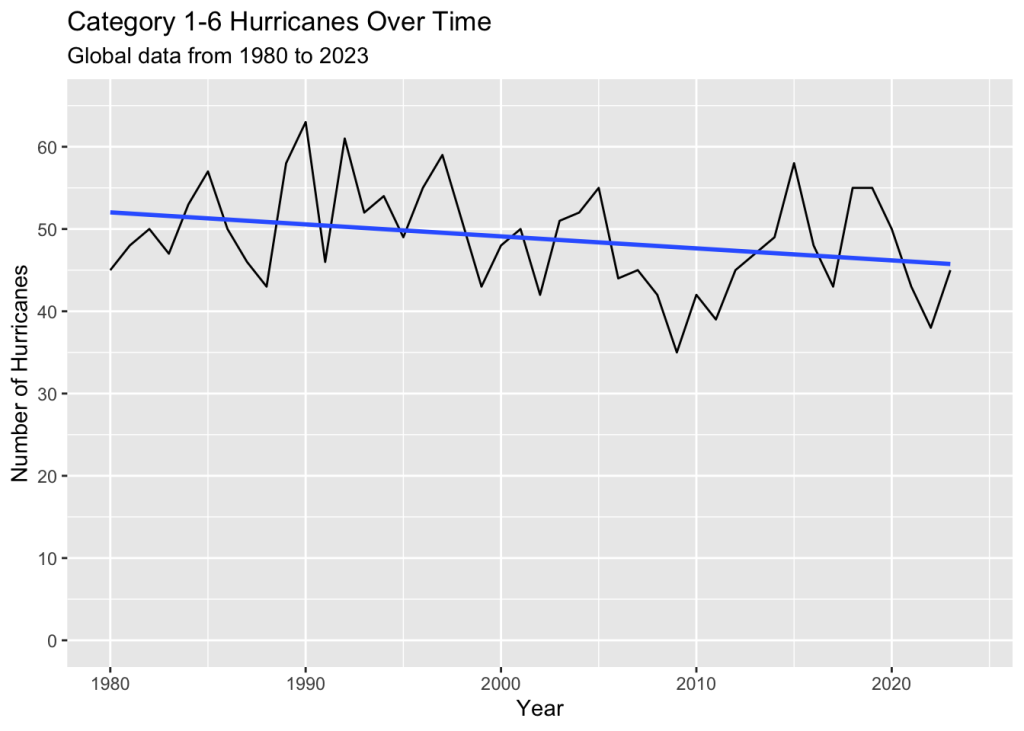
Looking at the data across different regions, we can see a similar trend. Most ocean basins, with the exception of the South Atlantic and North Indian, experience around 10 hurricanes per decade. As of May 2024, most basins have recorded approximately 5 hurricanes, seemingly on course to reach the expected 10 hurricanes by the end of the decade.
So this raises the question, what is an above average hurricane season if hurricanes aren’t becoming more frequent?
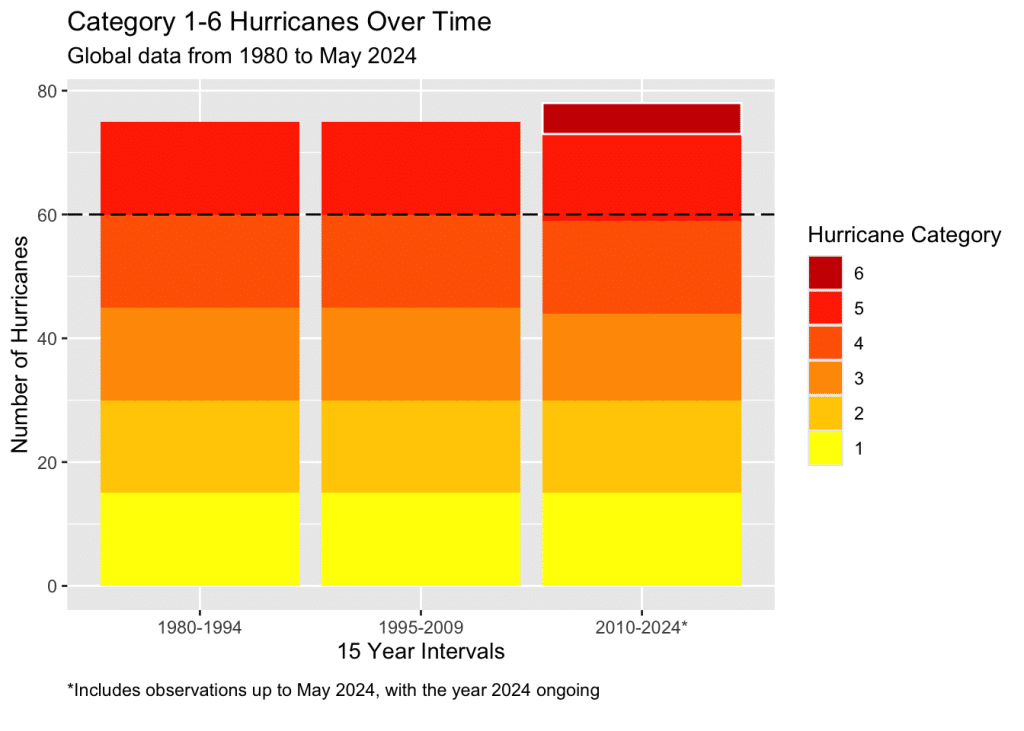
There has never been a Category 6 hurricane before the year 2013.
When zooming out to observe 15 year intervals, the same pattern unfolds across our international data; there is a nearly identical number of Category 1-4 hurricanes occurring over each time period. However, there is one alarming shift in recent years: the emergence of Category 6 hurricanes. Before 2013, no recorded hurricanes ever met the threshold for Category 6. These hurricanes are characterized by higher wind speeds capable of much more catastrophic damage, especially near coastal areas.
With a focus on the recent emergence of Category 6 hurricanes, our investigation then turned to examining the average wind speeds of hurricanes over time. As depicted in the graph below, there appears to be an ongoing upward trend in average wind speeds by year.
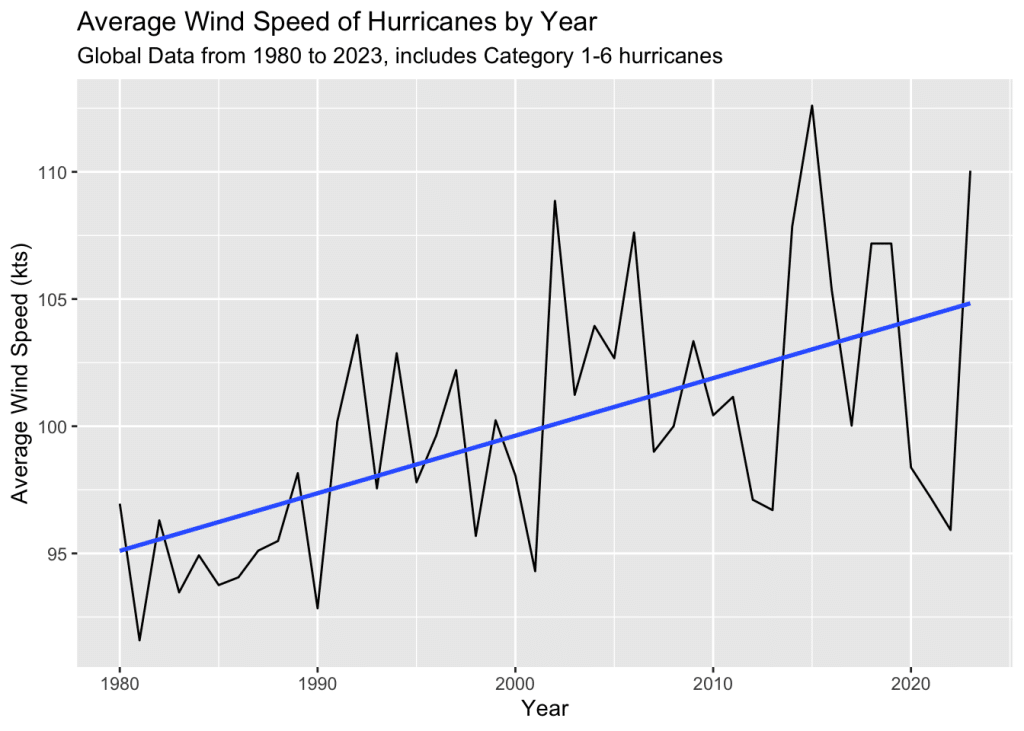
To validate this trend, we conducted further analysis to assess the correlation between average wind speed and year. The calculated correlation coefficient (~0.57) indicates a moderately strong relationship, suggesting that hurricanes have indeed been getting stronger on average in recent years.
According to our linear model, average wind speeds increase by approximately 0.217 knots per year on average. Our statistical tests confirm that this increase is statistically significant (with a p-value of 0), and the narrow confidence interval (0.121-0.314) around the coefficient of 0.217 reinforces the precision of our linear estimate.
| Statistic | Value | Description |
|---|---|---|
| Slope | 0.217kts | The average increase in wind speed per year, calculated from the linear model. |
| Correlation Coefficient | 0.57 | Indicates a moderately strong positive relationship between average wind speed and year, ranges between -1 (strong negative correlation) and +1 (strong positive). |
| P-Value | 0 | The probability (0 being none, 1 being 100%) that this observed relationship exists purely due to chance. |
| Confidence Interval | 0.121kts – 0.314kts | The range of values within which the true slope of wind speed increase per year is likely to lie, with 95% confidence. |
These findings underscore the concerning trend of escalating hurricane intensity over the years, potentially leading to more catastrophic damage from these severe storms.
Case Study: U.S.A
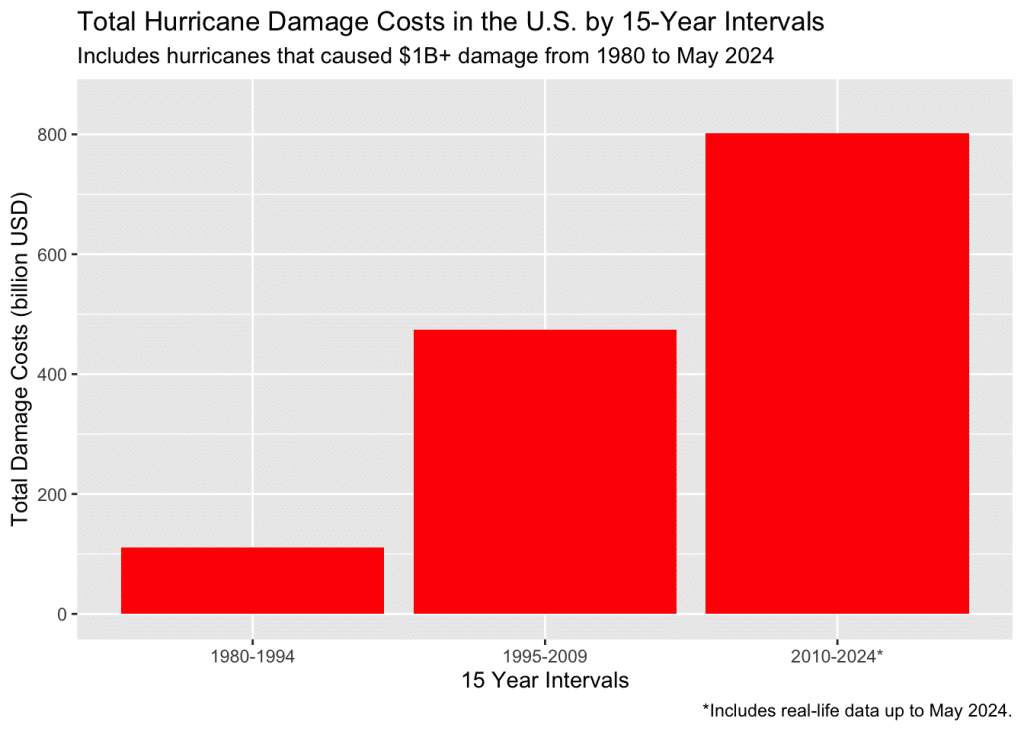
Financial impact is one of the metrics used to quantify the resulting damage of tropical cyclones and conceptualize their impact on existing infrastructure. As such, we used the United States as a case study to evaluate the economic impact of hurricanes and identify comparable trends. Our focus was on storms that caused 1 billion dollars of damage or more when they occurred–these costs were adjusted based on the 2024 Consumer Price Index. In total, our analysis encompassed 52 storms occurring between 1980 and May 2024 that had a direct impact on the United States.
The chart below illustrates how the cost of damage caused by hurricanes in the United States has skyrocketed over time. Every 15 years, this amount grew by over 300 billion dollars. In the most recent period alone, costs totaled to around 800 billion dollars. This staggering figure is more than seven times the total costs incurred from 1980 to 1994.
Analyzing the data by decade revealed even more striking disparities. The damage costs incurred in the 2000s exceeded those of the 1980s by more than tenfold, while the 2010s’ costs were nearly thirteen times that amount. In the early 2020s, we have not only surpassed the individual damage costs of the 1980s and 1990s but also their combined total.

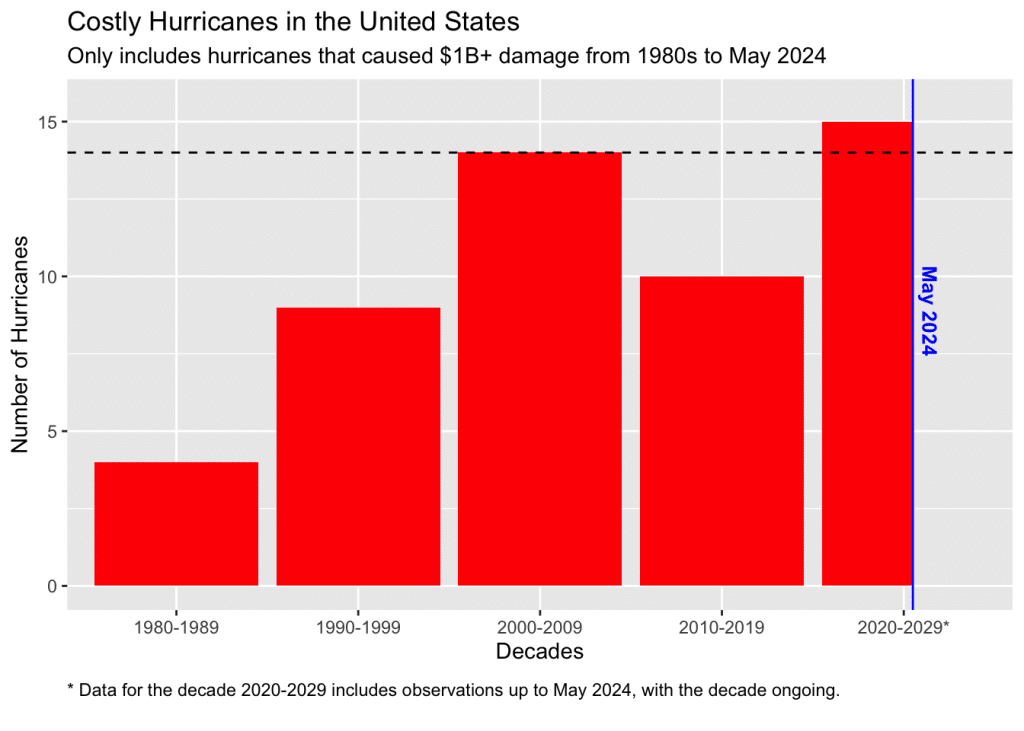
Alongside growing costs, the frequency of hurricanes causing over 1 billion dollars of damage has continued to rise as time goes on. When looking at the chart below, we can see that each decade since 2000 has exceeded its 1980s and 1990s counterparts. While we are only halfway through this current decade, the United States has already experienced 15 hurricanes that caused over 1 billion dollars of damage—more than any previous decade. This number is only expected to rise.
Conclusion
Hurricane Beryl marks a violent start as the first major hurricane of 2024. With wind speeds surpassing the Category 6 threshold, it underscores the alarming trends outlined in this study. These trends are a stark reminder that none of our weather phenomena is isolated from the escalating impacts of the climate crisis. Long-term greenhouse gas emissions caused by actions such as burning fossil fuels have significantly warmed the ocean. The higher wind speeds and intensity of hurricanes are largely fueled by rising ocean temperatures, which allows them to gain more speed and power.
As storms like Beryl continue to exhibit increased intensities and destructive potential, reducing greenhouse gas emissions and addressing the root causes of the climate crisis remain imperative to protecting the world from future disasters.
More on the topic: What Are Tropical Cyclones? Hurricanes and Typhoons, And Their Link to Climate Change
This story is funded by readers like you
Our non-profit newsroom provides climate coverage free of charge and advertising. Your one-off or monthly donations play a crucial role in supporting our operations, expanding our reach, and maintaining our editorial independence.
About EO | Mission Statement | Impact & Reach | Write for us


![The Statistics of Biodiversity Loss [2020 WWF Report]](https://u4d2z7k9.rocketcdn.me/wp-content/uploads/2020/12/lprwinkyTHB-544x306.jpg)


